


Article
How to Add Editable Areas to Exported MailChimp Templates

Aug 15, 20142 min Read
Continue Reading

You spend a boatload of money on your website, but how do you know it’s successful? It’s one of those questions business owners frequently wonder about but don’t actively seek to answer. Instead, they often make marketing decisions based on gut feeling.
Exhibit A: Well, I feel like the phone has been ringing more often, so I think what we’re doing is working.
Exhibit B: We don’t seem to be as busy this year as we were last year. I think we should stop doing internet marketing.
Business decisions should be driven by data, not by a perception of how busy you are or by how much you think the phone is ringing. But just what data should you use?
There are a lot of junky metrics out there. If you really want, you can find data that will make any marketing campaign look great. Look, your unique daily visitors from Bing by tablet users doubled this past month!
Here are some of the best metrics for measuring success. The important thing is not just finding the right data; you have to use it the right way.

Let’s start with the most obvious. Yes, you need to measure conversions. That means you need to know what you’re trying to convert. It could be sales, revenue, contact form submissions, newsletter signups, whatever. You wouldn’t believe how many businesses simply aren’t tracking conversions. I’ve seen clients with five years of data in Google Analytics and absolutely ZERO goals set up. What’s the point of tracking anything if you aren’t tracking what matters the most? We’ve even seen people running AdWords campaigns without any goals. How can you possibly know if your campaign is paying off? If you aren’t tracking conversions, you might as well delete your analytics and ask a crystal ball how to market your site.
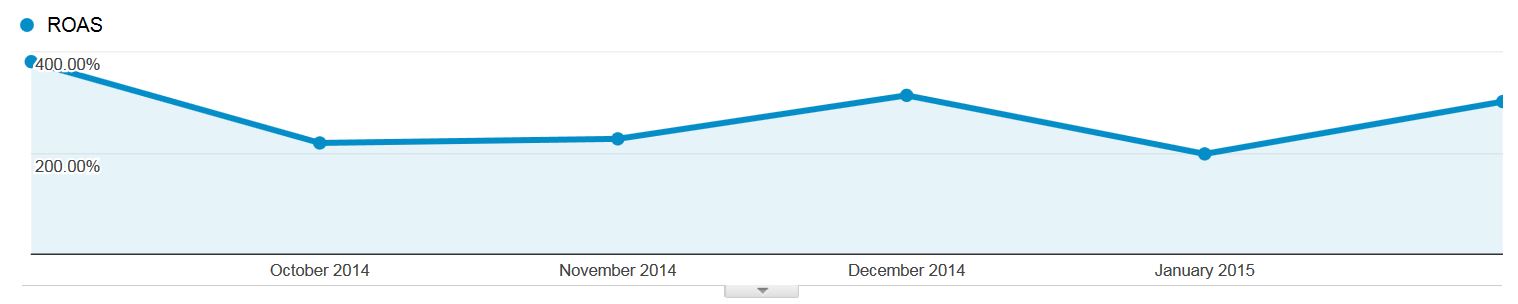
What’s the best way to know if your marketing efforts are actually paying off? Calculate your ROI and ROAS. No matter what type of marketing you’re using, every business owner should be aware of return on investment (ROI). This metric is a measurement of your profits relative to your costs. In theory, ROI is pretty simple to calculate (at least for ecommerce websites). Subtract the cost of your goods from your revenue and divide that by the cost of the goods. Things get a little trickier for lead generation sites. You have to know a few things, like how much revenue a sale/lead is worth and how much you invested in making that sale. Of course, these are things every business owner should know, but many people seem to struggle when asked how much a customer is worth to them.
Return on ad spend (ROAS) is a great metric for an ecommerce site. It directly shows how your ads are doing relative to sales on your website. ROAS calculates how much revenue your ads have generated (and Google calculates it for you!). If you sold $1000 worth of goods and spent $100 on ads, your ROAS is 1000%. Not too shabby. Of course, this isn’t a measurement of profit, but it is an excellent indicator of whether or not your ads are working.
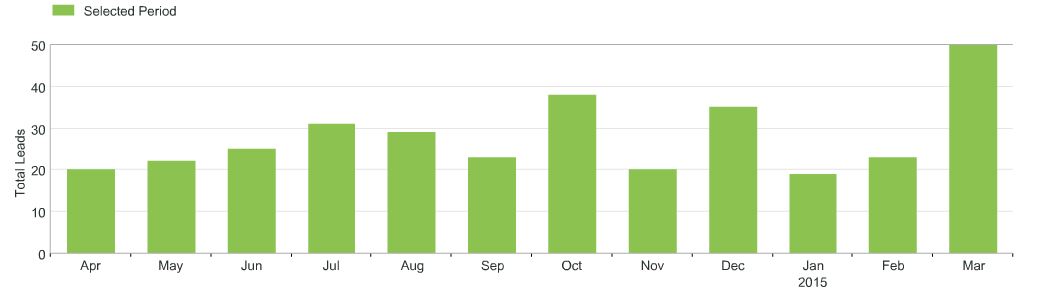
Knowing how many conversions you get each month is great, but you also need to know the rate at which these conversions occur. But you need to go about it in a way that makes sense.
The most basic conversion rate possible is the number of conversions divided by the number of visits. So if you had 100 orders and 1,000 visits, then your conversion rate is 10%. But this might not be the best way of measuring your conversion rate. Maybe half of those orders are from dealers who buy every time they come to your site. These dealers are making your conversion rate look a lot better than it is. Segment them out and you have a more accurate picture of how often your general visitors are converting.
What if your site serves multiple purposes? Maybe half of your site is dedicated to educating people and the other half is selling your product. That 10% conversion rate probably isn’t a true indicator of your success. You might get a better picture by creating a segment that only looks at visitors who viewed a product.
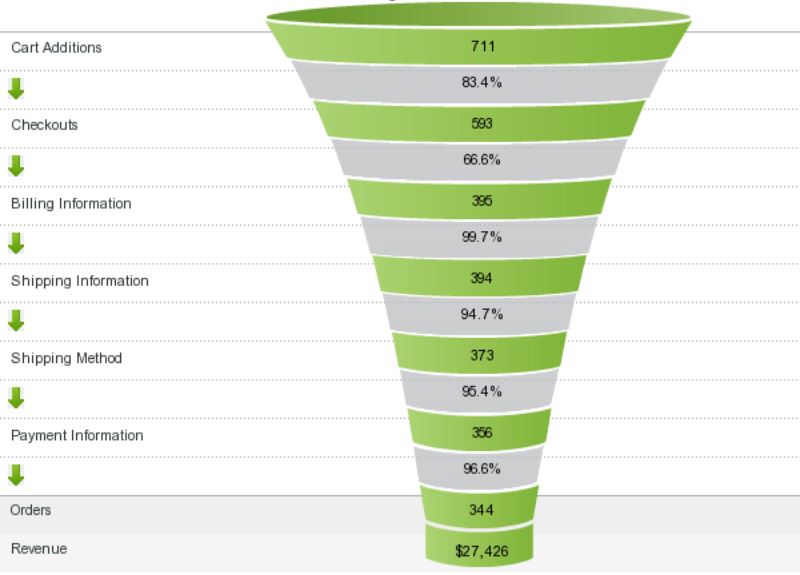
Conversion funnels are also hugely important, especially for ecommerce sites. What percentage of your customers who put something in the cart actually start the checkout process? How many customers who start the checkout process actually place an order? Where do most of your customer drop out? These are things you need to know if you ever hope to improve anything.
The key here isn’t to make the numbers look better or worse than they are. What you’re trying to do is make the data more usable. Once you find out a true conversion rate, you can start to make informed changes. If you’re looking at the wrong numbers, you might make changes that are pointless.
We all know the famous saying about bounce rate: they came, they saw, they puked. But how are you using bounce rate? If you’re just looking at the total percentage of bounces each month and saying, "That doesn’t look too bad," then you might as well just make up an arbitrary number instead.
If you only look at bounce rate holistically, then it isn’t going to tell you much of anything. Yes, it will tell you that 47% of visits last month resulted in a bounce. But what does that mean? Does it mean that 47% of visitors hated your website? Probably not, but you can’t ever know just from that number. You need to get creative.
Get your free template to help you balance what and where your spending.
Easy-to-Use Google Sheet
Free Marketing Budget Template
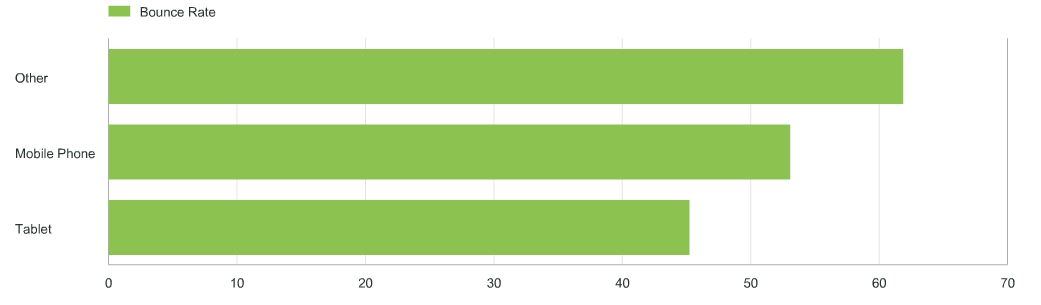
To get something out of bounce rate, you need to break it down. Look at which pages have the highest bounce rate. If your total bounce rate is 47% but your homepage has an 85% bounce rate, then maybe the homepage experience is lousy. Look at bounce rate by device type or browser. If 75% of mobile visits result in a bounce while only 25% of desktop visits do, then you may have an issue with your mobile usability. Now that’s data you can actually use.
Don’t just use bounce rate as a universal indicator of how happy people are with your website. Use it as a tool for making adjustments to your site and your marketing campaigns.
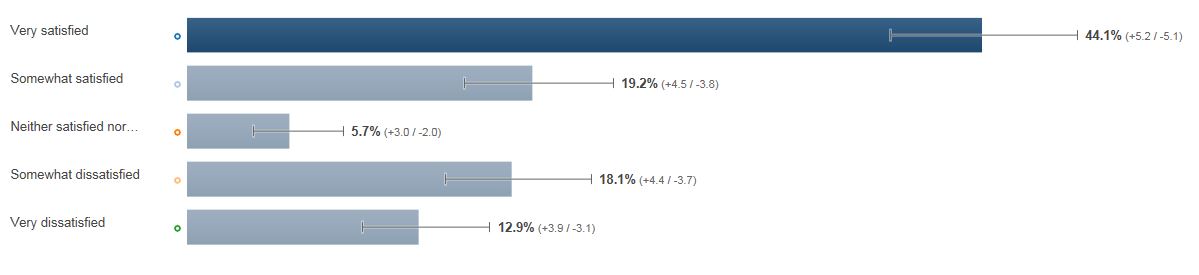
Speaking of how happy people are with your website, do you actually know if people are satisfied with your website? Perhaps the reason you aren’t selling enough product or getting enough leads is because your visitors don’t like what they see. Or maybe they have come to your site with false expectations. Or maybe they just aren’t the right audience. Whatever the case, customer satisfaction can be a helpful metric in guiding your marketing campaign. But how do you measure this? Here’s a crazy idea: ask your customers. Get feedback directly from your visitors. You can add a standard Google consumer survey to your site for free. With these four simple questions, you can find if your visitors are satisfied with your site, why they are visiting your site, what they don’t like about your site, and whether or not they are successful in their visit. Keep in mind that your visitors aren’t experts on web design, but they are your target audience. You may want to listen to them.
While conversion- and engagement-driven metrics are the most important, we can’t forget about traffic metrics. More than anything else, every website owner seems to want tons of visits. You can’t blame people for wanting this. A lot of visits suggests your site is popular. If your website is popular, you’re more likely to get leads or sales. In reality though, visits don’t mean that much on the surface. What good are 10,000 visits if you only had 10 sales? Still, many site owners have said something along the lines of, "Yeah, we’re getting tons of leads. But when are we going to start getting more visits?"
Visits are important. They can serve as an overall indicator of how your marketing efforts are working. After all, a big part of marketing is getting people to come and check you out. Get them in the door. If your visits drop drastically during a particular period, this might be an indicator of a problem with one of your marketing channels.
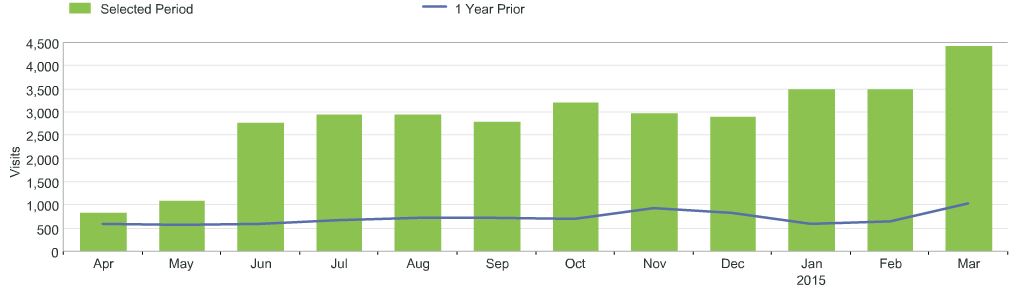
There are some dangers in paying too much attention to your visits though. The number of visits you get each month can vary widely, and it may not always equate to your marketing efforts. For example, a huge spike could be from spam bot referral traffic. Or maybe you were running AdWords last year and you aren’t this year. Or maybe one of your blog posts was a hot topic on Reddit for a day. Sometimes offline media can even cause surprising spikes in direct traffic. When you’re comparing year-over-year traffic, you need to be aware of what might have caused these fluctuations.
Paying attention to visits can also help you notice a major problem. If you notice a huge drop in visits, maybe your site is no longer indexed. Or maybe your analytics code was blown out. Let the metrics help you find potential problems and the possible solutions.
Okay, A/B testing itself isn’t a metric. It’s an experiment, but it leads to metrics, and those metrics lead to informed changes that can increase your conversions. If you aren’t testing something on your website or with your marketing efforts right now, then you should be. You can test just about anything. Different calls to action, different product layouts, different contact forms, different headlines. Collect data over a period of time and see which option performs better. But before you make any definitive changes, be sure your data is statistically significant. Don’t redo your product pages because one layout sold 2% more products after 7 days of testing.
If you aren’t paying attention to the right metrics—and using them the right way—then your marketing campaign can never really be successful. Don’t rely on your gut when it comes to your business success. Pay attention to the data and use it wisely to make informed decisions.
This post is part of Internet Marketing Mysteries, a weekly column addressing actual client questions related to SEO, analytics, website best practices, and any other topic connected to internet marketing. Have a question you’d like to see tackled in a future post? Let us know in the comments.
Nate Tower is the President of Perrill and has over 12 years of marketing and sales experience. During his career in digital marketing, Nate has demonstrated exceptional skills in strategic planning, creative ideation and execution. Nate's academic background includes a B.A. with a double major in English Language and Literature, Secondary Education, and a minor in Creative Writing from Washington University. He further expanded his expertise by completing the MBA Essentials program at Carlson Executive Education, University of Minnesota.
Nate holds multiple certifications from HubSpot and Google including Sales Hub Enterprise Implementation, Google Analytics for Power Users and Google Analytics 4. His unique blend of creative and analytical skills positions him as a leader in both the marketing and creative worlds. This, coupled with his passion for learning and educating, lends him the ability to make the complex accessible and the perplexing clear.

