
Google Data Studio Blog Series: Step 1 – Getting Started
Analytics reporting just got a whole lot easier thanks to Google’s release of Data Studio. The new platform’s seamless integration with Google Ads, Analytics, Search Console, and many other popular web tools through third-party integrations has made creating and analyzing powerful reports much less time-consuming and much more accessible for marketing teams. Trying to make sense of an in-depth report can be an overwhelming task, especially if you don’t know where to start. Here are four key things to consider when first getting started with Data Studio to ensure the numbers and your understanding of them are perfectly aligned.
Define Your Audience
Who is the intended audience of your report? A report used internally by the marketing team to monitor day-to-day progress will look different than a report used to deliver monthly performance to executives. The level of detail and terminology will vary based on audience, and you need to make sure you’re tailoring the appearance and function of the report based on who’s reading it. The ultimate goal is a clearly understood and usable report so the people who need the figures can put them to work.
Define Your Goals
What are the goals of your marketing initiatives? Defining your objectives helps foster a greater understanding of what metrics you should be focusing on and including in your report. If you’re aiming to improve your business’s organic search performance while driving increased traffic to a few select pages, those metrics should take precedent over others in the way the report is presented. Take your goals into consideration and place an additional emphasis on those figures and what you can do to drive their improvement.
Define Your KPIs
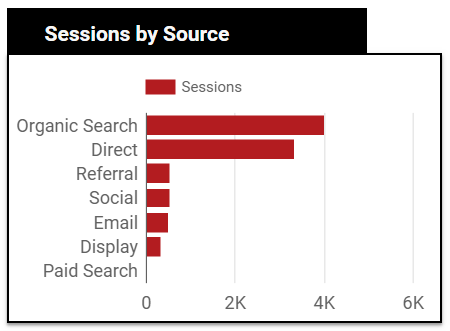
How are you measuring the success of your initiatives? Defining your key performance indicators will not only help you understand what metrics to include in your report, but it will also help you interpret and use the numbers to achieve positive results in the future. Maybe you’re hoping to boost your customer retention. Maybe increasing brand awareness is your top concern. Whatever your indicators may be, you should define them when crafting your marketing plan and use them to help assemble an effective report.
Define Your Report Goals
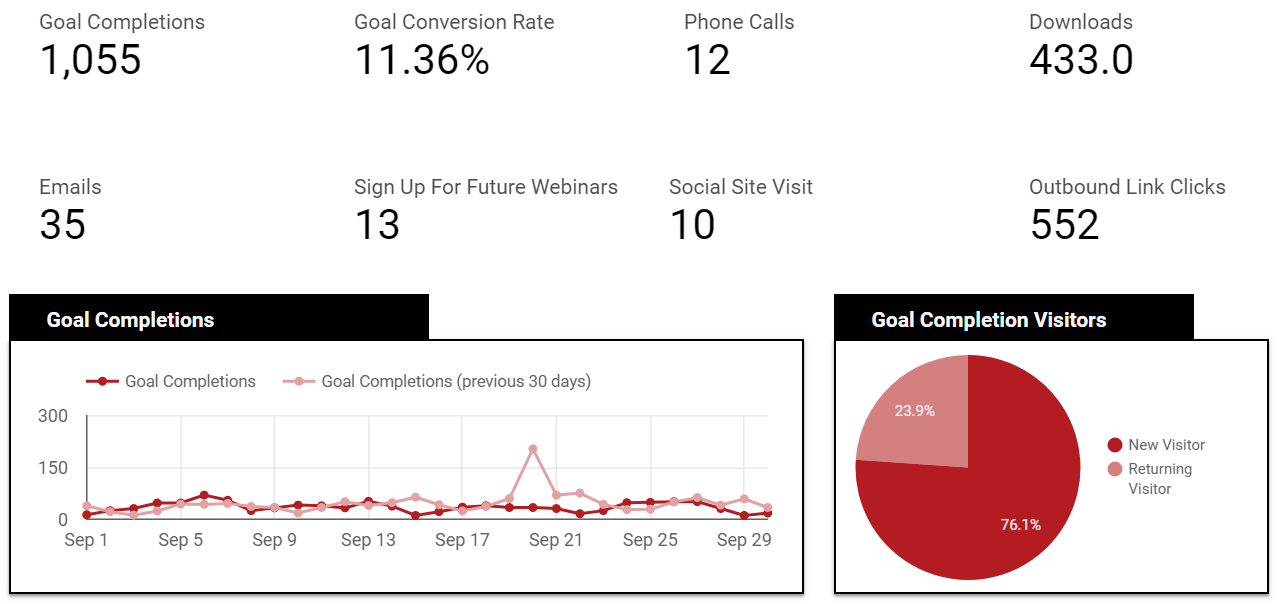
What is the story you are trying to tell with this report? Data Studio makes it easy to pull a lot of data in a short amount of time – but you don’t need to include all this information in every report. Each metric included should serve the purpose of the report and the narrative it is trying to illustrate to those invested.
Whether you are a beginner or an experienced Google Data Studio user, taking a moment to understand the purpose of the report will help smooth out the process. Data Studio is a powerful reporting tool that can help marketing teams and analysts cut down on time spent creating reports while improving on marketing efforts overall.
Digital Marketing With Perrill
Perrill is a full-service web design, development, and digital marketing agency experienced in creating and utilizing effective, readable reports in a way that drive our clients’ businesses forward. Contact us today to take your online presence to its full potential.
In the next part of our Google Data Studio Blog Series, we will be looking at the primary reasons we choose to use Data Studio when preparing reports for our clients and for internal use.

